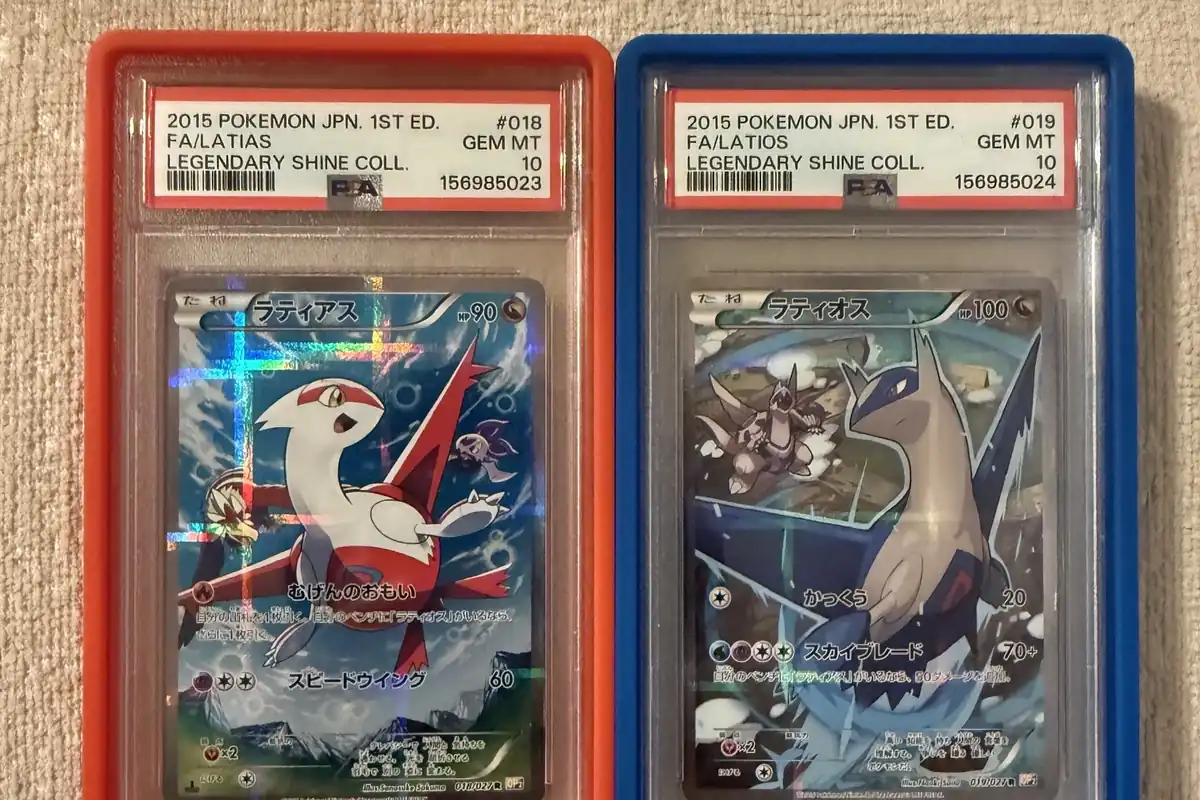
Why do collectors think only PSA 10s are worth holding?
Because a PSA 10 often sells for several times what a PSA 9 of the same card does, and a big price gap is easy to read as a big return. The 10 is the trophy, and it's natural to assume the trophy grows fastest.
You hear it at shops and see it online: a 10 sells for a huge number, a 9 of the same card sits far below it, and the lesson people take is that only 10s matter.
But price level and price growth are different questions. A 10 being expensive tells you what people paid. It doesn't tell you whether it went up faster than a 9 over the same months.
To answer that, you have to compare like with like. For every English card with eBay sales of a graded copy in two months six (or twelve) months apart, we compared the typical sale price at each end, grade by grade, next to the same card's raw price over the same months. Only real sales count, and a month needed at least three of them.
Do PSA 10s rise faster than PSA 9s?
No. Over six months, PSA 10 slabs rose a typical +36% and PSA 9 slabs rose +34%.[1] That's close enough that it shouldn't decide anything on its own.
The numbers
| Group | Value |
|---|---|
| PSA 10 (1,333 cards) | +36% |
| PSA 9 (1,282 cards) | +34% |
| PSA 8 (474 cards) | +52% |
| PSA 7 and below (191 cards) | +47% |
The surprise is lower down. PSA 8 slabs rose the most of any grade, a typical +52%, and PSA 7 and below came next at +47%. The trophy grade finished third of four.
It helps to check each grade against its own raw copies. The same cards raw rose +31% for the PSA 10 group and +37% for the PSA 9 group. So 9 slabs actually trailed their own raw copies, while PSA 8 slabs (+52% against +36% raw) and PSA 7 and below (+47% against +32% raw) pulled well ahead of theirs.
How much weight can each grade carry? The 10 and 9 figures rest on plenty of sales: 3,885 card-months across 1,333 different cards for PSA 10, and 2,817 card-months across 1,282 cards for PSA 9. The lower grades are thinner, with 778 card-months across 474 cards for PSA 8 and 485 across 191 cards for PSA 7 and below. Their lead is real in this data, but it sits on fewer cards.
Does a full year change the picture?
Not much. Over twelve months, PSA 10 slabs rose a typical +48% and PSA 9 slabs rose +47%, which is basically a tie.
The numbers
| Group | Value |
|---|---|
| PSA 10 (359 cards) | +48% |
| PSA 9 (163 cards) | +47% |
The raw copies tell a similar story. The same cards raw rose +54% for the PSA 10 group, more than their slabs did, and +47% for the PSA 9 group, matching their slabs.
Here's the big caveat. Graded sales history is deep only from mid-2025, so the twelve-month comparison is small: 522 card-months across 359 cards for PSA 10, and 218 across 163 cards for PSA 9. We don't have a twelve-month figure for PSA 8 and below. Treat the full-year numbers as a first look, not a settled answer.
Where are the PSA 10 believers partly right?
They're right that a 10 moves more money. The same percentage on a pricier slab is a bigger dollar move.
A PSA 10 often costs several times a PSA 9. If both rise by a similar percentage, the 10 owner gains several times as many dollars. That's a real difference. It cuts both ways, though: a drop of the same size costs the 10 owner more dollars too.
The 10s also edged the 9s at both lengths, +36% to +34% over six months and +48% to +47% over twelve. The gap is small, but it points the believers' way. And over six months, 10 slabs beat their own raw copies (+36% against +31%).
Finally, 10s and 9s are where most of the graded trading in this data happens. They make up the large majority of the card-months we could compare, so their figures are the firmest ones here.
What can't this data tell you?
Quite a bit, and it matters for how you read the numbers above.
- Grading fees and the wait aren't included. These are moves in slab prices. If you send a raw card in, you pay a fee and wait before you have anything to sell. Our post on how much a card has to rise before you profit walks through those costs.
- Each figure is the typical card, not every card. Roughly half the cards in each grade did worse than the figure shown, so your own card's move could be well below it.
- The full-year sample is small. Deep graded sales history starts in mid-2025, so twelve-month pairs are few, and there's no twelve-month figure for PSA 8 and below.
- It's the past. These are group figures from past sales. They say nothing about where any card or grade goes next.
- It's English cards only, with graded copies that sold often enough to measure.
What does this mean for you?
It means "only 10s are worth holding" doesn't hold up. In these sales, 9s, 8s and lower grades rose about as much as 10s or more, measured in percent.
If you own a PSA 8 or 9 of a card you love, this data gives no reason to see it as dead weight next to a 10. Which grade you hold is your call, based on what you enjoy and what you can afford.
Think in dollars as well as percent. A pricier slab swings further in both directions. And remember the raw copies of these cards rose too, so the slab wasn't the only version that gained.
If you want to follow this for your own cards, Pokelit shows graded prices from eBay sales where slabs have sold, next to raw prices updated every night from TCGplayer prices. On iPhone, its grade check reads a card's centering from photos before you send it in. For a similar look at another hobby argument, see whether vintage cards beat modern ones.
How we measured
For every English card with eBay sales of a graded copy in two months six (or twelve) months apart, we took the median sale price in each month and compared them, grade by grade, alongside the same card’s raw price over the same months. Only real sales count, read from the listing title, and a month needs at least three sales.
Data as of . Not financial advice.
Sources
- eBay, Sold listings of graded Pokémon cards. The slab sales behind our graded figures, recorded every night by Pokelit. Accessed .
Questions
Are PSA 10 Pokémon cards worth it compared with PSA 9s?
In percentage terms, PSA 10s didn't clearly outperform PSA 9s in our data. Over six months, PSA 10 slabs of the same cards rose a typical +36% and PSA 9 slabs +34%. Over twelve months it was +48% against +47%, though that sample is small. A 10 does move more dollars because it costs several times a 9, in both directions. These figures don't include grading fees or the wait.
Which PSA grade went up the most?
PSA 8 was the grade whose slabs rose most over six months, with a typical move of +52%. PSA 7 and below came next at +47%, then PSA 10 at +36% and PSA 9 at +34%. The lower grades rest on fewer sales, 778 card-months for PSA 8 and 485 for PSA 7 and below, so their lead sits on thinner data than the 10s and 9s. Past moves don't tell you future ones.
Do graded cards go up more than raw cards?
It depends on the grade. Over six months, PSA 8 slabs rose +52% while the same cards raw rose +36%, and PSA 7 and below rose +47% against +32% raw. But PSA 9 slabs rose +34% while the same cards raw rose +37%. Over twelve months, PSA 10 slabs rose +48% while their raw copies rose +54%. Grading fees aren't included in any of these moves.
Do these numbers include grading fees?
No. The moves compare slab sale prices on eBay in two months six or twelve months apart, so grading fees and wait times aren't counted. If you're grading a raw card yourself, those costs come out of whatever the slab gains. Each figure is also the typical card's move, so roughly half the cards in each grade did worse than the number shown.
Why is the twelve-month comparison so small?
Because graded sales history is deep only from mid-2025, there are fewer cards with sales twelve months apart. The full-year figures rest on 522 card-months across 359 cards for PSA 10 and 218 across 163 cards for PSA 9, and there's no twelve-month figure for PSA 8 and below. The six-month figures are the firmer ones, with 3,885 card-months for PSA 10 alone.